From now until the 2028 election, we’ll be told with great confidence about what the economy will do, what Washington will do, what markets will do, how much of an impact AI will make, and what you must do about it.
This is mostly theater because markets, economics, and politics are multi-variate, non-linear systems. That's fancy language for something that has a lot of seemingly unrelated moving parts, where small changes can produce huge reactions in unexpected places, and where very little is predictable. This is not new. We just hear about it sooner than we ever have.
There are two elections, a new Federal Reserve board chairman, and adjustments in Middle East geopolitics that will challenge the most carefully crafted strategies. Looking back on New Years Eve 2019, no one had COVID (literally), the 2022 inflation, the 2025 Tariff Tantrum, or a military action in 2026 on their screens. Statistically speaking, someone will call what comes next. And statistically speaking, the odds of finding that someone round to zero. Risk is what’s left after we’ve thought of everything else.
So, what hasn't changed? And what can you control?
✅The importance of asset allocation and diversification. A portfolio spread across multiple asset classes, geographies, and company sizes does that work. Underperformers will recede in value while the things that are working grow larger. That’s why, if you’ve owned a large company investment fund, you’ve actually owned some Nvidia since 2001, when it replaced Enron in major market indexes. No guessing or research was needed. You control this. You decide what, where, and how to allocate and diversify. We can help with that.
✅Having a clearly articulated strategy. Complexity and over-thinking invites tinkering. Tinkering often leads to unforced errors and self-inflicted damage. If you’re not clear about what your strategy is, we need to talk.
✅The quality of media. Headlines are optimized for emotion and urgency. “If it bleeds it reads.” “News” is actually opinion, no matter which political color you identify with. Don’t conflate politics with your portfolio.
✅The urge to “do something.” We all get that from time to time, especially when emotions are running hot. If a strong opinion calls to you, create a financial sandbox. Put money in it that won’t change your life if you lost it. That will minimize any damage and manage your FOMO.
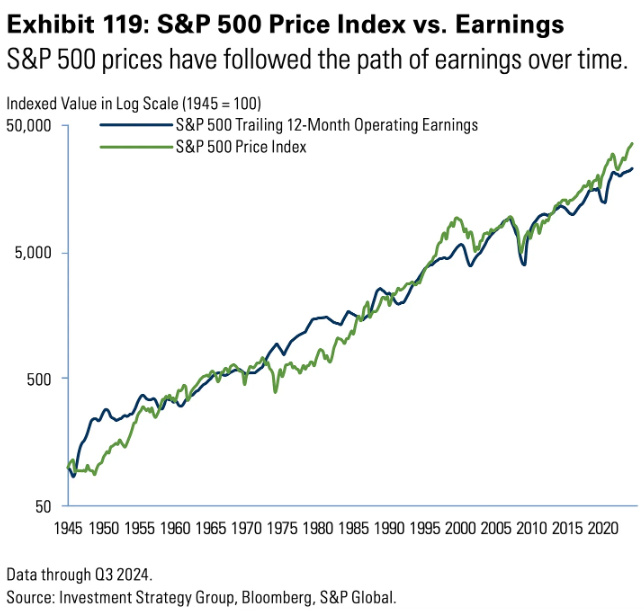
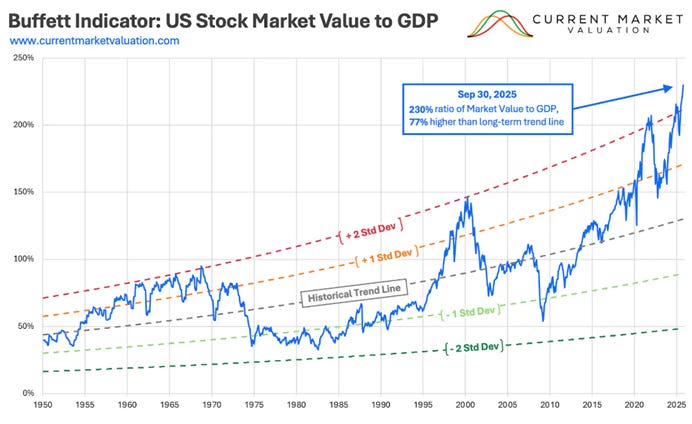
✅Long-run stock returns closely reflect corporate profits. As we’ve shown in prior Considerations, that’s been the case for over a 100 years. That said, U.S. large growth company valuations—the premium that investors are willing to pay for those earnings—are historically rich. That takes us back to asset allocation and diversification, which rewards patience more than activity.
“Unprecedented” events will continually pop up. But no matter what unfolds, these five pillars will help you stay the course according to your goals, time horizon, and tolerance for discomfort. We’re here to travel this journey with you.
James Cosgrove, CFP, Plano, TX jim.cosgrove@verizon.net
972-489-0262
Jim Cosgrove, Partner, San Jose, CA jimcos42@gmail.com
408-674-6315
Evidence-based. Rules-driven. Policy-focused.