Globally Diversified Portfolios
The portfolios of most Americans exhibit significant and unjustified home country bias-- the tendency to favor their own country's securities more than other countries.
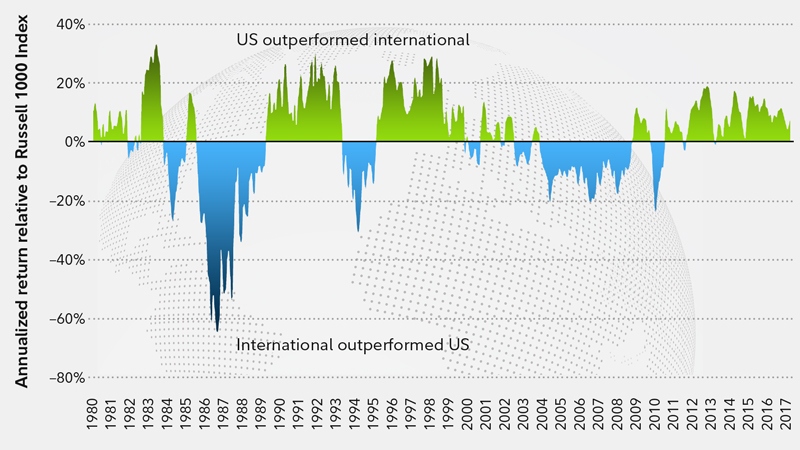
In fact, US and non-US stocks historically move to their own drummers. The charts below illustrate this. And that's really why globally diversified portfolios contain both US and non-US stocks. This is the source of the so-called diversification benefit.
But just how much of an allocation to non-US stocks does a portfolio need to have to be effectively diversified? Here are some guidelines:
- The value of non-US stocks is about 45% of the world's total and US stocks are about 55%. So, a globally diversified portfolio could begin there. It means that 45% of the equity portion of a portfolio could legitimately be in non-US stocks.
- Vanguard's Life Strategy and Target Date Funds are quite close to this. They consistently maintain a 40% non-US allocation in those funds.
Interestingly, a recent Vanguard Blog post, from which several of the charts shown below were drawn, drew comments that were unanimously hostile to international investing. This only encouraged to me to add my own comment-- something I do about once every 10 years-- to say that I just love it when everyone gets on the same side of the boat. It's the biggest 'tell' there is. Perhaps I should be more direct: I'm a huge proponent of international investing.
Global equity valuations: Cheap again.

https://www.topdowncharts.com/single-post/2019/01/27/Global-Equity-Valuations-Cheap-Again

https://www.fidelity.com/viewpoints/financial-basics/investing-in-international-stocks

https://vanguardblog.com/2019/02/14/the-case-for-global-equity-investing-and-a-happy-marriage/
About Correlation
Correlation measures the tendency of two investments to move in the same or opposite direction. Highly correlated assets pretty much move together; lowly correlated ones tend to diverge. Correlation does not measure magnitude and correlation is rarely cause.
VTI (total US stock market) and VXUS (total international stocks) have a very high positive correlation-- .88-- but very different returns. Why is this good? In the chart below, you can see that between 2002 and 2007, U.S. stocks nearly doubled, while international stocks nearly tripled. In the last few years, U.S. stocks have far outperformed.

No one knows which will do better over the next few years. In the meantime, owning the world still provides diversification in this highly correlated world.
Countries Adding the Most to Global Growth

A recent paper by Bridgewater Associates highlights the skewed allocations of many portfolios and argues for a more diversified approach. For additional points of view on this topic, go here, here, here, and here.
Update: June 7, 2019
From Morningstar: Investors Have Fewer Reasons than Ever for Home Bias.
Update: May 24, 2019
From a Vanguard paper titled "Embracing A Global Stock Market."