Residential Real Estate
The topic here is residential real estate. We're not talking investment real estate or rich dad, poor dad strategies for building wealth; that's a whole different topic that you can read about here.
Residential real estate is a personal consumption item. You need a place to live; this is your cost of housing. It's a part of your ongoing necessary spending.
Here are two important disclaimers as you go through this material:
1. Take all the data with a wheelbarrow of salt; it's an approximation, not rocket science precision. As you've undoubtedly heard, real estate markets and the pricing in them is hugely dependent on...location, location, and location.
2. Since your residential property is a personal consumption item, the market price is only one factor in the overall profit advantage equation. Owners have mortgage interest expense, property taxes, insurance, maintenance and repair, some of which is offset by income tax deductions. But you get to call it home. That's called a psychic dividend, and earning it is a huge motivator and comfort for most people. If it also turns out to be a "good investment," that's great.
3. The data and material have been derived from the work of Ben Carlson and my own calculations. You might come up with different numbers. Given those disclaimers, how does Santa Clara Valley real estate compare with other areas?
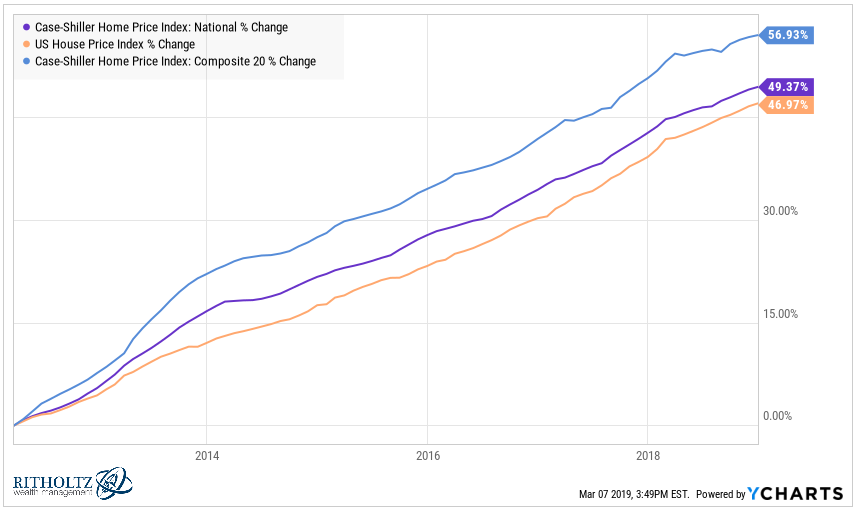
1. On the first chart, the national indexes show price increases of 47%-57% since the real estate bottom in 2012. During the same period, the San Jose area has experienced an increase of about 127%. I'll leave it up to you to decide if that's good or bad.
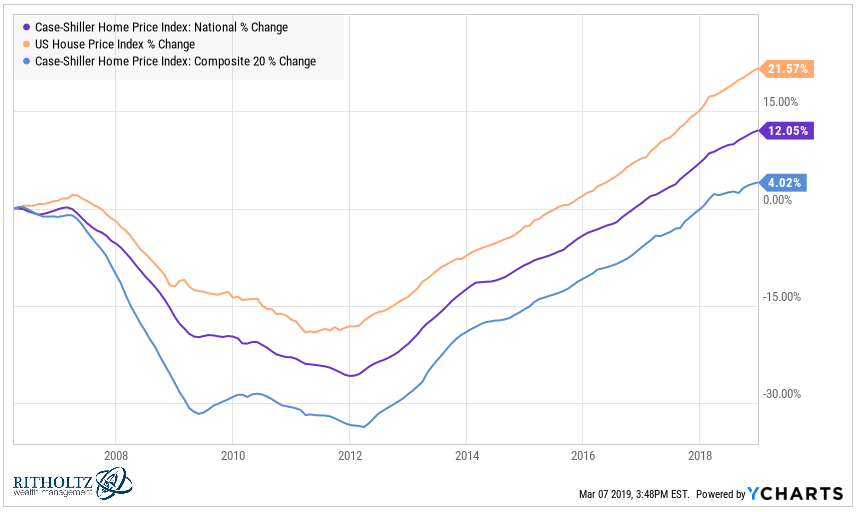
2. From the top in 2006, the national indexes show price increases of 4%-22%. For the San Jose area, the increase has been about 34%. That works out to 2.5% a year. Before costs. Over the same period, US stocks were up 8.5% a year and the Vanguard REIT was up 5.7% a year. Past performance says nothing about future performance.
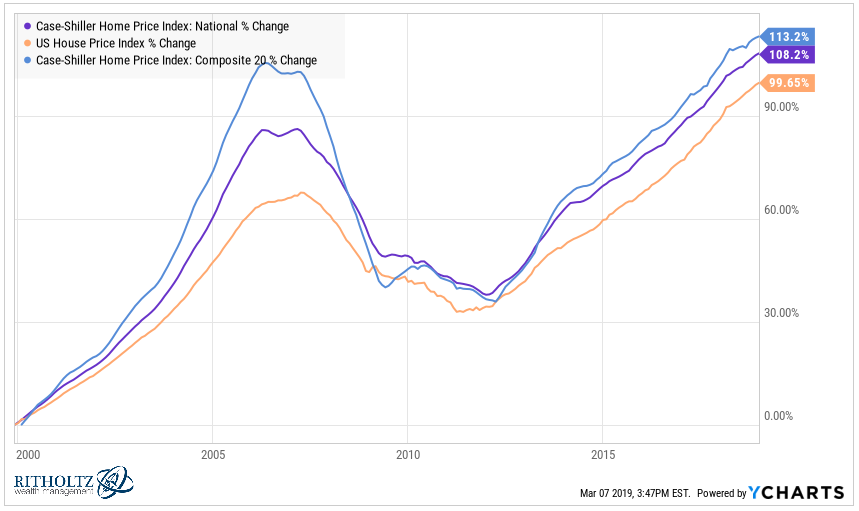
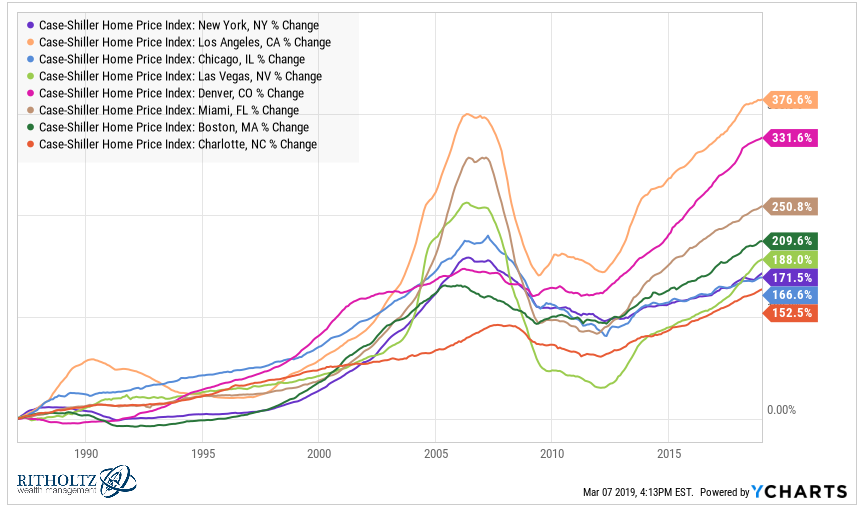
4. The final chart in this series covers the last 30 years. If shown here, my calculation would place the Santa Clara Valley area the upper portion of the chart. But perhaps the most glaring point is the obvious-in-hindsight existence of the mid-2000's bubble. We are not currently in such a precarious state.
On timing the market, Carlson concludes that "based on the historical data there could be ample opportunity to see a drop in prices. It happens more often than most would assume. But I have no idea what sort of signals you would use to try to time this decision, and even if you did, it may not matter for the area or specific house you are targeting."
Further, "...trying to time this market probably sounds like a great idea but the possibility of waiting for a very long time could lead to some serious regret. The fact that individual markets are so much more volatile than the overall real estate market invites more volatile behavior by the participants. I would worry more about being able to afford the house you want rather than trying to time the market."
References:
How Often Can You Buy the Dip in Housing?
The Real Estate Market in Charts