Saturday, April 19, 2025

What We're Thinking: Silver Linings


Silver Linings 2022

The news, opinions, chaos, and sentiment for a large part of the population is deeply negative. We get it. But this has happened before. Hear us out. 

The University of Michigan Consumer Sentiment Index has been published monthly for over 50 years. It's proven to be a reliable send-ahead on whether to lean into or lean away from investing.

 Michigan Consumer Sentiment

Since 1974, the Index has fallen below 60 in only 4% of all the months, including the most recent reading. That makes this situation quite rare.

In those few extremely negative cases, the stock market- measured by the S&P 500- was higher five and ten years later. Every time. Not only was it higher, but in 71% of the cases, it was higher by more than the well-known 10% average per year. Leaning in paid off. Silver lining.

Next chart. The CNN Fear & Greed Index. 

This Index is a composite of seven stock market indicators. The plots here are monthly through 2024. Since then it has slipped to under 25. Extreme Fear. That's only happened four other times in its history. Each time was an opportunity to lean in. Silver lining.

Next topic. Some factoids about recent markets.

Earlier this month, the S&P 500 was down 12% in four days, one of the largest 4-day declines since 1950. What happened in prior similar cases? Stocks moved substantially higher over the next 1, 3, and 5 years. Every time. Silver lining.

While the S&P 500 was sinking, the Volatility Index (VIX) had its 3rd largest 4-day spike. That put it in the top 1% of its historical readings. Stocks bounced back every time. High volatility = fear = opportunity for long-term investors. Silver lining.

Those were about the downside. What happens when things go up?

Well, on April 9th, the S&P 500 had its largest one-day gain since 1950. What happened in the past following big 1-day gains? Stocks moved substantially higher over the next 1, 3, 5 years. Every time. Silver lining. 

The Dollar
Lots of noise here, too. But when we look at this 40-year record, we're like, meh. Not the end of the world. Not even close. We're about in the middle of the historic range. Lets talk about something else.

The Bond Market
Like the dollar, lots of noise. We use the 10-year Treasury as a basic reference. The rise from near zero rates in 2020 to 5% happened by October, 2023, where this chart begins. Since then, rates have fluctuated between 5% and down to 3.6%. Right now, we're at 4.3%, about right in the middle of the range.

One of three things are most likely from here. Inflation could heat up. Recession could set in. Or there's a combination of the two- stagflation. In the inflation scenario, maybe this goes north of 5. If its recession, we'll be seeing something under 4. Stagflation? Things stay about the same. Stay tuned.


Conclusions
So, what do we do? Historically deep funks like this have happened before. And each time, they've been the nurseries of astonishing rebounds. Every time. We're leaning in. Let's not let a good crisis go to waste.

That said, the short term is typically volatile, messy, not profitable, and stomach-churning, Having sufficient assets outside of the stock market to draw upon as needed is essential. We're also comforted by knowing that anyone reading this already has a globally diversified portfolio with an asset allocation appropriate to their situation and temperament. But maybe you'd still like to talk it over. That's what we're here for. We love those conversations.

James Cosgrove, CFP, Plano, TX jim.cosgrove@verizon.net 972-489-0262
Jim Cosgrove, Partner, San Jose, CA jimcos42@gmail.com 408-674-6315

Evidence-based. Rules-driven. Policy-focused.


Sunday, April 6, 2025

What We're Thinking: Crisis and Opportunity


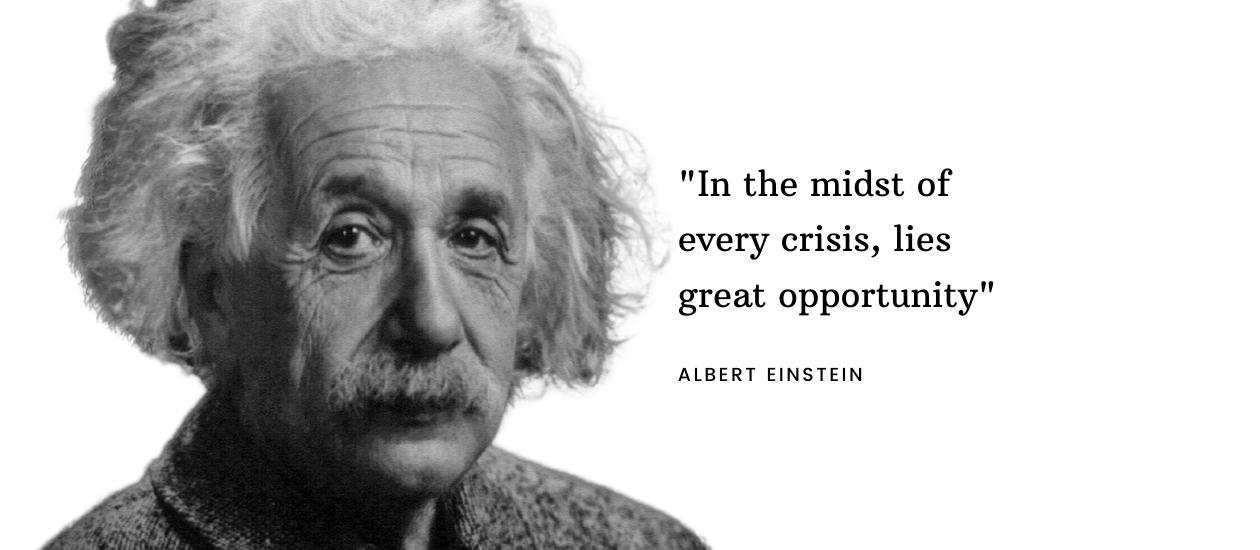
You've heard the news. You cannot have missed it. None of it seems good. Yet, serious analysts and asset managers are as puzzled as the rest of us. That said, last week, Michael Cembalest at JP Morgan wrote, “Here’s the interesting thing about the stock market: it cannot be indicted, arrested or deported; it cannot be intimidated, threatened or bullied.” And of course, there's Einstein. He seemed to have a pretty good grasp of things.

With that, we fall back on classic, time-tested, simple observations for framing our personal finances. Simple beats complex (Occam's Razor). Use these to frame your own outlook. They are general statements and do not constitute specific, individual advice. Reach out to us if you'd like to discuss your household needs, goals, and aspirations. 

1.  Markets continuously match Expectations with Reality, for as far as its eye can see. This is often called "pricing in." When new information arrives, it's "priced in." Immediately. Thousands of AI-driven tools make it happen. "Pricing in" is what's happening now. Remember this when you might start thinking you know better than the market.

2. Volatility is not Risk. Risk is the permanent loss of capital, mainly through inflation and deflation. Volatility is fluctuation or what William Bernstein calls "shallow risk." Volatility is what sows the seeds for future results. Current levels of volatility have only occurred five other times since 1990 (CBOE Volatility Index at St. Louis Federal Reserve). All of them were Opportunities to sow the seeds for future gains.

3.  Reversion to the mean was originally a biologic concept (Francis Galton). It's also become a law of economics and markets. Things go from one extreme to another and always revert toward the mean. See our Considerations post of February 13, 2023, here.

4. Two emotions drive investor sentiment: Fear and Greed.

The noisy looking chart below shows the entire history of the CNN Fear & Greed Index through 2024. (We created it via a Perplexity AI query.)

The Index currently sits at 4, on a scale 0-100. It has been under 10 only seven other times in its 14 year history. Each time was a precursor to a significant market advance.  

Cue Warren Buffett: Buy when others are fearful. Sell when others are greedy.

 CNN Fear and Greed Index (2011-2023)

5. Bonds and inflation don't play well together. We saw that in 2021-22. Right now, there's a flee to the perceived safety of bonds. Except for short-term holdings, we're not fans. Our 5-year rule applies. Any money that you might use in the next five years belongs in a cash or fixed income place. 

6.  Sharp Down markets are often followed by sharp Up markets. Missing those sharp Up markets will permanently reduce your long-term investment results. (JP Morgan)

7. Down markets do not cause recessions, but all recessions are preceded by down markets. See our Considerations post of March 12, 2025, here.

8. Down markets are opportunities to welcome the Gift Horse. See our Considerations post of February 27, 2020, here.  

This is where we're at folks. As noted above, we're here to have the necessary conversations you might need right now.


James Cosgrove, CFP, Plano, TX jim.cosgrove@verizon.net 972-489-0262
Jim Cosgrove, Partner, San Jose, CA jimcos42@gmail.com 408-674-6315

Evidence-based. Rules-driven. Policy-focused.