Back in the Spring of 1991, I joined IBM's Quarter Century Club, marking 25 service years. Now, in the Spring of 2026, I'm celebrating another Quarter Century milestone, this time as an independent, freelance financial advisor. Two quarter centuries in one lifetime. Who knew?
Doing what I'm drawn to do, I've pulled together some financial stats from the last 25 years. Here's what's happened on an average annualized basis:
Portfolios of 40% stocks and 60% bonds 4.1%
Bay Area residential real estate 4.7%
Portfolios of 50% stocks and 50% bonds 5.2%
Portfolios of 60% stocks and 40% bonds 6.3%
Portfolios of 80% stocks and 40% bonds 8.4%
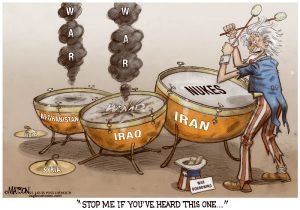
Now, zooming in to the Main Event.
We're a bit more than halfway through this decade and there have been four "disruptions" no one predicted. COVID in 2020-21, 9% inflation in 2022, a Tariff Tantrum in 2025, and now a "military operation" in Iran.
Keep this in mind the next time you hear an "expert" or "influencer" tell you what's about to happen and what you must do now! Predictions are useful for eliminating things to worry about. It's been said that "risk is what's left after you've thought of everything else." Which leads to the next point: It's impossible to worry about unknown unknowns.
The table below highlights market data points we follow as of March 27, 2026. Notice that none of them are personal or political. We don't conflate personalities or politics with personal finance. That dog don't hunt.
| Mar 2020 | Oct 2022 | Apr 2025 | Mar 2026 | Notes | ||||||
| COVID | Inflation | Tariffs | Iran | |||||||
| Money market funds | 0.10% | 4.00% | 4.20% | 3.60% | 1 | |||||
| US Treasury 10-year bond yield | 0.80% | 4.00% | 4.00% | 4.30% | 2 | |||||
| Brent North Sea oil | $32 | $83 | $92 | $114 | 3 | |||||
| CNN Fear & Greed Index | 2 | 16 | 4 | 10 | 4 | |||||
| Peak VIX | 85 | 36 | 60 | 35 | 5 | |||||
| Balanced portfolios prev 12 months | -23% | -29% | -20% | -8% | 6 | |||||
| Balanced portfolios next 12 months | +42% | +18% | +26% | ? |
Notes:
1. Most banks are still paying .1%. The difference between that and 3.6% is how we're able to get free checking accounts.
2. This is the key indicator for fixed income. The rate has fluctuated between 3.3% and 5.0% since 2022. As long as it stays under 5%, all's well. Not a prediction or investment advice.
3. Few paid much attention to oil until lately. Suddenly, everyone's an oil expert. What's most useful to know is that oil above $90 puts pressure on global finances, discourages drillers, and punishes consumers. There are incentives all over to get this mess cleaned up.
4. The CNN Fear & Greed Index is a reliable short-term measure of financial market sentiment. Anything under 25 is Extreme Fear. As Warren Buffet has said, "Buy when people are fearful." Not investment advice.
5. VIX is the Chicago Options Exchange Volatility Index. It's another measure of sentiment widely used by professionals. Readings above 30 have been harbingers of better times.
6. Balanced portfolios are found as funds and ETFs at Vanguard, Fidelity, Schwab, and your own favorite broker. Most investor's portfolios are pretty close to these. Check with us to talk about what you have.
So, that's where we are. A long time ago, I heard someone say, "Things are never as bad as they seem, or as good as they seem." If you'd like to chat about any of this, or even tell us how we're getting it all wrong, we'd love to hear it.
James Cosgrove, CFP, Plano, TX jim.cosgrove@verizon.net
972-489-0262
Jim Cosgrove, Partner, San Jose, CA jimcos42@gmail.com
408-674-6315
Evidence-based. Rules-driven. Policy-focused.