Friday, October 11, 2019

CONSIDERATIONS, October, 2019


Considerations, October, 2019

“Change your words, change your world.”

Words matter.  What we say and how we say things reflect and shape our attitudes and behaviors. Meanings and intent change over time. Remember when gay just meant happy? It still means happy. And more.

Here are three personal finance topics whose meanings and intent need to change.

 Image result for expenses

Expenses

People use expenses to mean the money they must spend. But often it sounds like they’ve just had their pocket picked-- that they’re victims or innocent bystanders. This makes it very easy to excuse away impulses, poor money management habits, and thoughtlessness.

Let's call it what it is: Spending.

Spending is something we actively choose. So, if we can choose it, then we can exercise proactive control and responsibility over it. This makes it more powerful than trying to figure out market or economic trends.


 Image result for emergency fund
Emergency Fund

Maybe it’s just me, but demands on my cash can seem notoriously random and unexpected. I could make the case for an emergency happening nearly every month.

So, it's useful, convenient, comforting, and even essential to have a cache of cash set aside to cover those things. Call it a Reserve. That way you don’t have to wait for an “emergency.”

The size of a sufficient Reserve will vary from household to household. And because its key features are its Safety and Liquidity, it’s never invested in the stock market. Reserves are found in savings accounts, money market funds, CD’s, bond funds. Do your investing elsewhere.

 Image result for risk tolerance

Risk Tolerance

Investment ads and financial advisors quickly get you thinking about risk tolerance. It’s essential to talk about risk, but the “risk” they’re talking about is the wrong one. They’re talking about tolerance for volatility. That’s not risk. Risk is…

·       The impact of your investment capital losing its purchasing power.
·       The consequences of your investments not growing enough to meet an important goal.
·       The destruction of capital through confiscation, taxation, stupidity, or fraud.

Impacts. Consequences. Destruction. Those are real risks. They are forever. There are no do-overs. Your tolerance for these risks can easily be quite low.

Volatility is not risk. It's the price we pay to avoid real risks. Don’t be swayed by attempts to minimize volatility at the expense of failing to meet important goals. Your volatility tolerance should be as high as you can stand it and your real risk tolerance can reasonably be zero. 

“Change your words, change your world.”

Thursday, August 29, 2019


CONSIDERATIONS, AUGUST 2019 


Image result for just one thing 

The economy.
Peter Lynch, legendary Fidelity fund manager is known to have said, "If you spend more than 13 minutes analyzing economic and market forecasts, you've wasted 10 minutes."

Well, I'm not Peter Lynch, so you'll have to bear with me for just a little more than 3 minutes. This brief, no-nonsense, drama-free treatment is meant to get you comfortably on with a worry-free financial life. It'll also shield you from the pernicious effects of what other people might be telling you and what you're hearing in your self-imposed echo chamber.

Here are the paragraph headings if you want to scroll down fast. In some paragraphs, there are clickable links. Just use those if you're interested in the background or want to take a deeper dive.

The normal yield curve.
The yield curve right now.
Why is this?
Well then, who sets all the other interest rates?
Is there something special about a flat or inverted yield curve?
Are we close to a recession now?
Will tariffs or trade issues cause a recession?
What will happen to real estate if there's a recession?
Bottom line, what should I do?

Press on.
~~~~~~~~~~~~~~~~~~~~~~~~~~~~~~~~~~~~~~~~~~~~~~~~~~~~~~~~~~~~~~~~~~~~~~~~~~~~~~~~~~~

The normal yield curve.
One of the most frequently heard terms these days is yield curve. Good grief, what's that?! We actually wrote about it in our blog back in March. You don't have to go back and read it. This note is a re-cap and update.

Here's a normal yield curve. It shows the interest rate that lenders receive for loaning money for different lengths of time. Notice how interest rates go up from the lower left to the upper right. In a normal world, the longer you loan money, the more interest you earn, yes? 
 Image result for normal yield curve
Lenders are ordinary folks like us as well as pension plans, insurance companies, mutual funds, and so on, all over the world. For example, you're a lender when you buy a CD.

The yield curve right now.
It's pretty flat. Everything is squeezed in between 1.5% and 2%. No one is earning more for lending longer.
Data from the US Treasury Department
Why is this? 
Some people might want you to believe that the Federal Reserve, aka "the Fed," "controls" interest rates. That's only partially true. The only thing the Fed does is set the Fed Funds Rate. That's the rate they charge banks and other financial institutions for overnight loans to clear the previous day's financial transactions. On the yield curve, the Fed Funds Rate is just one point at the far left or in the lower left corner.

Well then, who sets all the other interest rates?
The bond market!

Like stock prices are set in the stock market between buyers and sellers of stocks, bond prices are set in the bond market between buyers and sellers of bonds. Keep in mind that when bond demand is high, interest rates fall. When bond demand is not so strong, interest rates rise. Interest rates have been in a general downtrend since the early 1980's.

Is there something special about a flat or inverted yield curve?
As we pointed out last Spring, a flat or inverted yield curve has often presaged a recession. But the yield curve by itself is neither a cause nor a tripwire for a recession. It's just a picture of the bond market's assessment of future economic conditions. The actual causes, timing, and severity of any slowdown or recession are highly variable. So, there's no point in trying to game it.

Are we close to a recession now?
This 50-year graphic from the ECRI (Economic Cycle Research Institute) suggests that we're near the edge of slipping into a recession. But as you can see (1988, 2010, 2012, 2015), it's not 100% reliable. Nothing in markets is perfectly reliable. Furthermore, none of this says anything about the depth or duration of a recession, if it does happen. But I'm sure that Tweeter-in-Chief will keep us informed.πŸ™„
image.png

Will tariffs or trade issues cause a recession?
Global economies and financial markets are complex, chaotic, adaptive systems. What happened in a prior similar situation may not happen again. Yet, we ignore history at our peril.

Tariffs, trade issues, and executive orders have been a feature of the US economy since the beginning. George Washington issued the first tariff. Presidents Clinton, Bush, and Obama declared 42 national emergencies. Trump has signed four, so far.
We press on, regardless.

The lesson is that we've been here before. History may not repeat, but it rhymes. It's not different this time. There's always something to worry about. Trade is an ongoing, troubling, yet manageable challenge. Stay the course.

What will happen to real estate if there's a recession?
As we've all been taught, real estate is about location x 3. It's also about affordability.

According to Zillow, in the past year, median property values are -9% in the San Jose area, -13% in Palo Alto, -7% in San Mateo, flat in San Francisco, and -1% in Walnut Creek and Santa Rosa. Wow. If stocks had that kind of widespread downturn, we'd certainly be hearing about it.

These modest declines have nothing to do with location or recession and everything to do with affordability. Employment and incomes must keep growing to support rising real estate values. In some places, they are not. A recession will be a headwind for real estate. But that will also make it a buyers market, and with low mortgage rates to boot.

Bottom line, what should I do?
There are three things you can do-- three things over which you have absolute control:

1. Ignore the Tweeter-in-Chief's tweets. He's totally talking his re-election book. And by extension of that, avoid letting your political preferences-- whatever they are-- drive your investment strategy. That dog don't hunt; those dots don't connect. Remember when Trump was elected and "everyone" thought the market would tank?πŸ˜‰ Those "everyones" missed a 100% advance.

2. Advisors and investment firms always talk about knowing your risk tolerance. We take a different view on that. What you need to know is your volatility tolerance. How much tolerance do you have for watching your portfolio's value decline? Think in dollars, not percentages. A 25% decline (not that unusual) would trim $250,000 from your $1,000,000 portfolio. Would you be OK with that? Maybe this deserves a conversation. Call us. That's what we're here for.

2.1 Sidebar: People with large holdings of their company stock curiously seem to believe that their company's stock would not suffer in a market downturn because their company is just so good.😏 Don't be one of those people. Jobs and even whole companies can evaporate in a recession. I know; not yours, your neighbor's. Single issue risk can be devastating.

3. Find the places in your portfolio where bonds and other fixed income assets are sitting. That's what you'll want to use if stocks go into a funk. Have 3-5 years worth of likely withdrawals in sight. That way, you won't have to sell stocks low when they're becoming the thing you should be buying!


Any other questions? Contact a Jim.
In the Dallas-Ft Worth Metroplex    jim.cosgrove@verizon.net   972-489-0262 
In the San Francisco Bay Area       jimcos42@gmail.com          408-674-6315


Friday, July 12, 2019

Self-Employed? Sole Proprietor? You Can Save Big.

According to the Bureau of Labor Statistics (BLS), who tracks this kind of stuff, there are about 16 million workers in the US who are self-employed, tilling the soil of the gig economy, working a side hustle, or are otherwise on their own.

They are freelancers, part-timers, consultants, and small business owners. And yes, Uber drivers and Airbnb hosts are a part of the number. It's commonly thought these are mostly millennial age people, but in fact, such workers are spread across the entire labor force and demographic spectrum.

If you're among them, you should know there are powerful ways to save, invest efficiently, and enjoy meaningful tax breaks.

Here are three common and easily manageable ways to do this:

1.  Individual 401(k)
An Individual 401(k) works much like the 401(k) that large employers offer. In this case, the individual is considered both the employer and employee—and can contribute more as a result..

As an employer, you can contribute as much as 25% of your earnings. As an employee, you can also contribute up to $18,500 a year—plus an additional $6,000 if you’re over age 50.

It doesn't stop there. You can even add after-tax dollars to a Roth 401(k)! No tax benefit upfront, but withdrawals later are tax-free.

Individual 401(k)s are best if you’re self-employed and work alone; having employees complicates things.

 Natalie Choate at Morningstar published this informative piece in July, 2019, on the topic.


2.  SEP IRA
A SEP (Simplified Employee Pension) allows you to make pre-tax contributions of the lesser of 25% of your earnings or $54,000 a year. You’re not required to contribute to a SEP IRA every year; that can be helpful if you have a slow year or take some time off.

If you have employees who are using a SEP, you can contribute to their plans as well. The disadvantage is that only the employer (you) can contribute; there’s no provision for employee contributions.

3.  SIMPLE IRA
This is an easy way for a small-business owner to set up a retirement plan that can be used to match employee contributions dollar for dollar up to 3%, or make a 2% minimum contribution to each employee earning at least $5,000 a year.

A SIMPLE IRA works best for small businesses with up to 100 employees. Employee contribution limits are $12,500 a year, plus another $3,000 for those age 50 and over.


If this sounds like something for you, let's talk.


Tuesday, March 26, 2019

Sound the Klaxon

Sound the klaxon! Yield curve inversion ahead!

Yes, it's a popular topic at the moment, and a good example of how narrative follows price. The trend toward inversions has actually been developing since 2011! There are dozens of variations. Just a cursory search on the St. Louis Fed's site (aka FRED) turns up 23 different series. But the 10year-2year and 10year-3 month spreads are widely popular.

Should we pay attention to this, or is it just another attempt by Wall Street to make us do something? Or for media to fill its time and space quotas with pointless stories and simplistic one-sided analyses?

The thrust of commentary largely centers on the implications for a recession. This is sure to stoke fear. The 'R' word creeps in. Recessions can mean people lose jobs, maybe their home or truck, or if they're lucky, only their portfolio gets whacked.

Here are two graphics that show a long history of yields in relation to recessions.

The first one is the 10 year-2 year Treasury note spread. Sure enough, yield inversions-- where the blue line dips below the zero line-- show up about a year or two before recessions.
image.png


Here's a similar presentation that shows the 10 year- 3 month spread. Same message.
image.png
So, what does history tells us?
  • Inverted yield curves usually precede recessions. But the lead time is long. That's because bond traders tend to be right and early. 
  • Recessions are preceded by stock market weakness, partly because equity traders also tend to be right and early, and partly because recession dating (done by a committee at the NBER) lags the real world. Since the stock market is actually a leading economic indicator, a lot of the financial damage is done before the recession reaches its nadir.
  • Hence, recessions and their accompanying stock market declines have proven to be wonderful buying opportunities for informed, disciplined investors like you. The key word there is 'disciplined.'
So, here's the money chart:
image.png
This is from the end of WWII. The red bars mark recessions. The grey bars mark bear markets. Notice that you don't need to be in a hurry with your tactics.

Here's what to do:
  • If a recession developed, imagine what it would be like if a person in your household lost their job. I know. It won't happen to you, it'll happen to your neighbor. But imagine it anyway. How might you proactively prepare for that?πŸ€”
  • Households with large holdings of individual stocks, usually purchased through employee purchase plans, stuffed in 401k's, or are a part of compensation, are hugely exposed if a company must work through necessary adjustments. I know. Not your company. Your neighbor's company. πŸ˜
  • If your total portfolio is more than 70% allocated to stocks-- even if they are well diversified-- disturbing value reductions can occur. Of course, they are not "losses" unless you sell. Regrettably, many people do just that. You've heard the stories. 😬
Between now and some possible future, the stock market could well gather a new head of steam and make new all-time highs. So, here are some questions to ask yourself:
  • What do I believe about the future? Investing is about expressing a view of the future.
  • What is my edge? What is my level of conviction about what I believe?
  • What happens if I'm wrong about what I believe? Am I willing to endure the possible consequences of that?
  • If I'm wrong, how will I reset and recover?
I'll spare you the Warren Buffett quote about swimming naked.
In the meantime, I've made a note to self to re-read this a year from now.
Make some notes for your self to re-read a year from now.
I'd love to hear your thoughts and opinions.

Additional follow-on comments:
This time it's different?
http://blairbellecurve.com/the-yield-curve-inverted-but-youre-telling-me-this-time-is-different/ 

πŸ‘‰Update 5-10-19 
So, after the inversion that took place a few months ago, there was a minor counter-reaction. This is not unusual; nothing happens in a straight line. But once again we're close to inversion again.

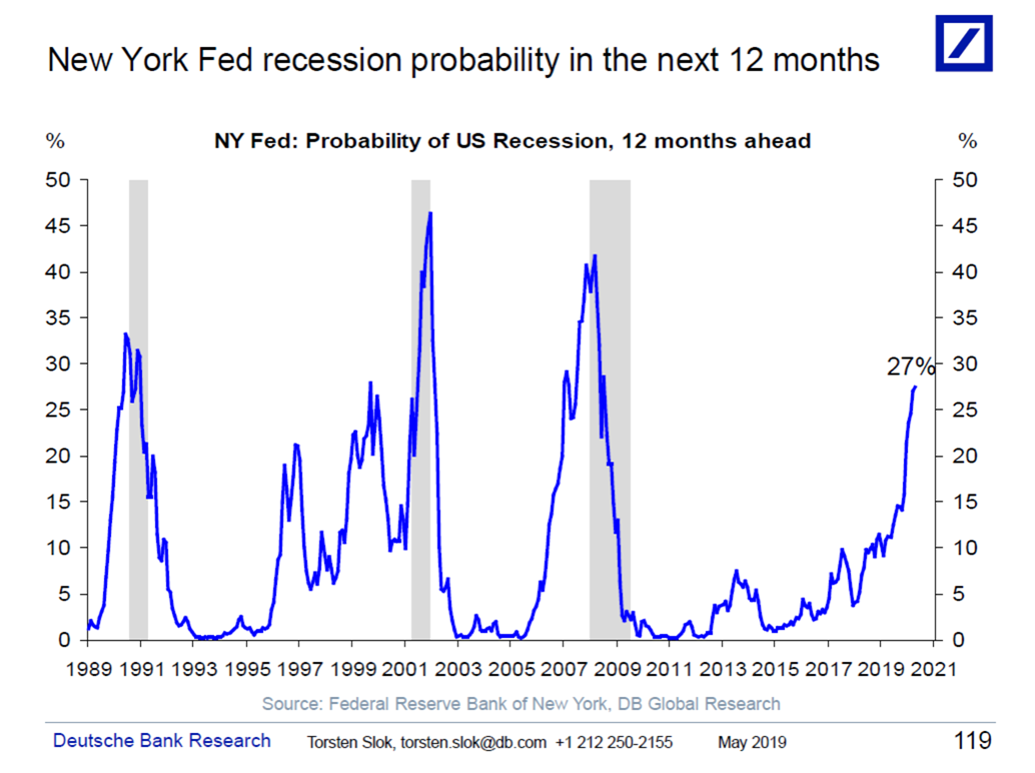
The second chart, below, from the New York Fed, shows that the probability for a recession in the next 12 months could soon be at a non-trivial level. Current hesitation in financial markets is, I believe, more about this than trade issues, the 2020 election, or anything else media babbles about.